- Atlas Portfolio
- Posts
- Following the technicals of RZLV
Following the technicals of RZLV
See what the charts are saying as the fundamentals continue to make this stock make heavy swings.
About via Stocktwits
|  |
6/24/25

6/30/25

Feature Story
Technical Analysis
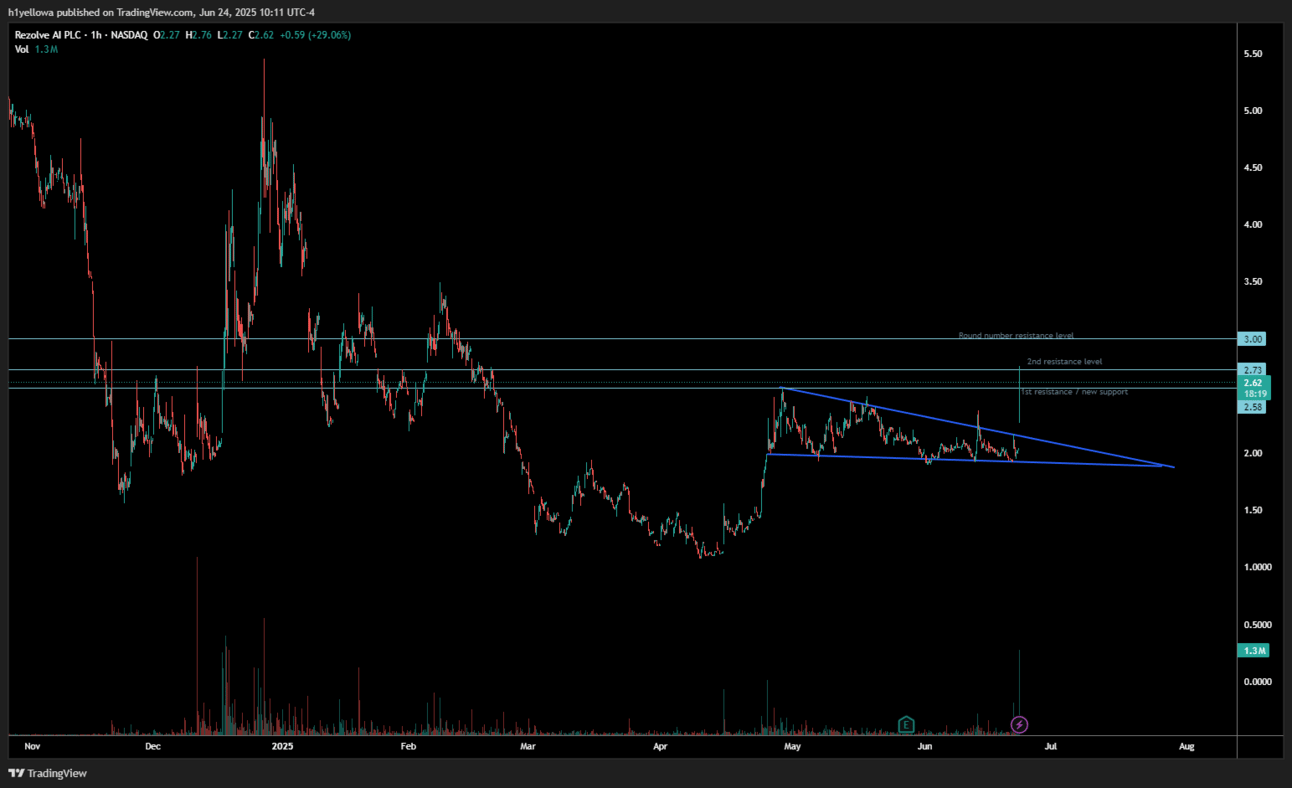
What we are looking at in the above chart is a descending pennant otherwise as a bullish flag. This flag lasted for about three months while retail and corporate investors were waiting to see if this stock would join the Russell 2000 and Russell 3000. Rezolve AI has continued to gain strategic partnerships and with this along with the Russell news, we saw a break out of the bullish pennant.
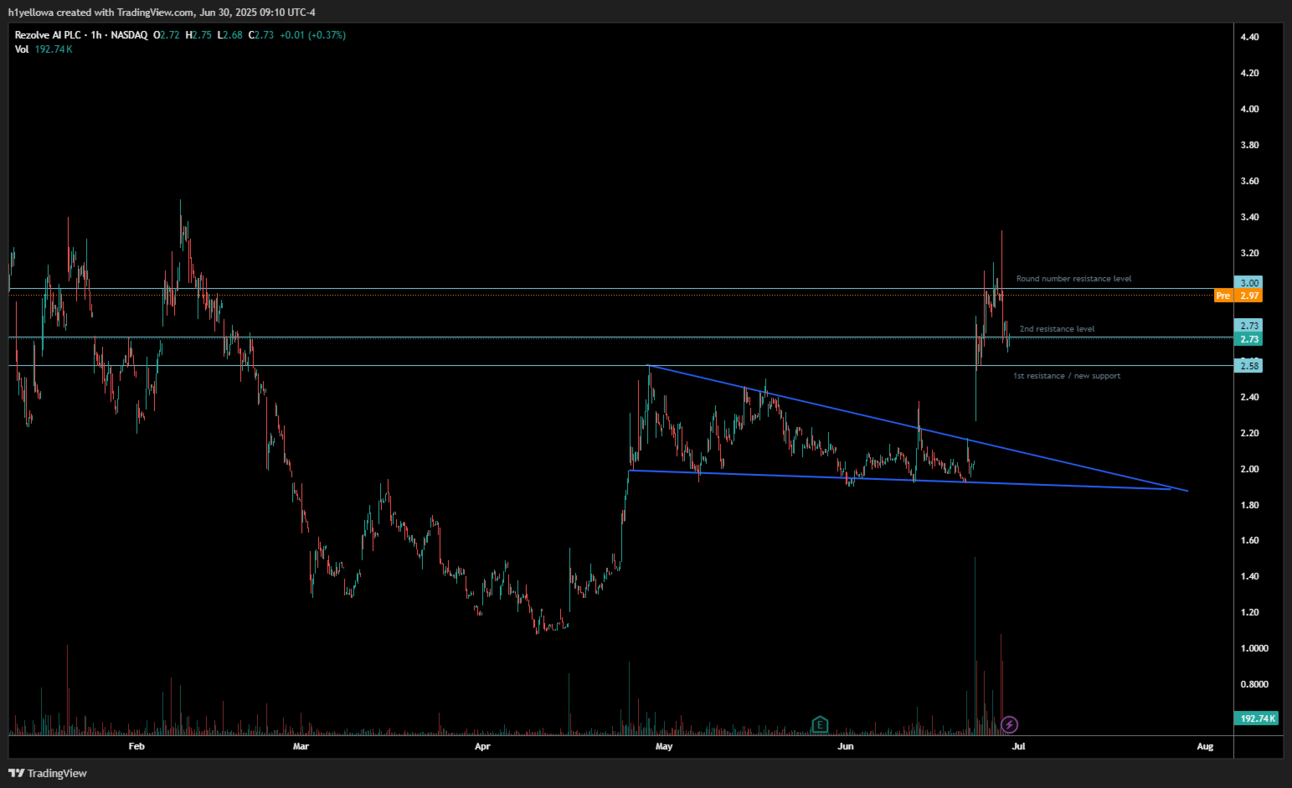
The trick now is to figure out where the price is going to go. Right now there are multiple factors that could influence the price but for the sake of this article we are going to talk about the technicals. On the chart, I pointed out three levels. The first was the $2.58 level. This was our first resistance when we broke out and I used this area due to it being the highest point in the bullish pennant. As you can see in the chart RZLV blew right past it making this now a new support level. which it held very well on the 1 hour chart. This created a new bullish pennant.
The second resistance level I put in was at $2.73. I chose this level due to the reverse head and shoulders back in Jan/Feb which you can see to the left of the chart. Not only did this prove to be an accurate resistance level for the day (June 24th) but it then created a good support level for the following day.
Finally the last resistance line I drew was at $3. I chose this because round numbers create walls. People don’t also look to sell at 2.96 but just round it out to $3. Also when playing a stock at this price, it is easier to make a mental goal to get out or to buy in at levels like this. $3 did prove to be a strong resistance from the 25th - 27th. We then saw a small dip after that but that was due to political news causing the whole AI market to come down which brought us back to the $2.73 support level.
A Final Note
Where do we go from here?
Look out for Russell index’s to pick up shares. Don’t expect this to drive up the price. My next resistance level for RZLV will be the $3.50 range. This number comes from the double top we saw at the end of January and the beginning of February. Continue to do your research. I expect it to stay around the $3 range as it tries to create a stronger support level here. Just be careful because if it gets rejected to many times we could see it retest the 3 month bullish pennant. Stocks at low prices like this are extremely volatile and anything can change it’s direction.
Never financial advise, just a thought.
Reply