- Atlas Portfolio
- Posts
- Following the technicals of RIVN
Following the technicals of RIVN
Rivian Automotive, Inc
About RIVNRivian Automotive, Inc. engages in the design, development, and manufacture of category-defining electric vehicles and accessories. It operates through following segments: Automotive, Software and Services. The company was founded by Robert J. Scaringe in June 2009 and is headquartered in Irvine, CA. |  |
Feature Story
Technical Analysis
Lets actually talk a little fundamentals first. RIVN is an interesting stock. As of writing this article RIVN sits at $13.07 on 7/7/25. When the stock was released in the end of 2021, we saw RIVN soar into the $100s but then immediately humbled and brought back down to Earth. It’s bounced its way around with news of new vehicles, political agenda’s, and as some would argue Tesla’s top competitor in the USA.
Wonderful, so why is TSLA over $300 and RIVN $13? There’s a lot to dive into with that question and we’ll start out by ignoring that the owner/CEO of TSLA is the richest man in the world. The electric vehicle market has been hit hard with the Trump presidency and his “drill baby drill” mentality. We saw the Biden administration offer a lot of benefits to owning an electric vehicle, just about all of which have been removed by the Trump administration. Not only that, tariffs have not been any automotive companies friend. American families are not in a position to make an expensive transition from the gasoline vehicles they are used to, to a brand new electric vehicle that may require electrical rework to the house in order to charge it.
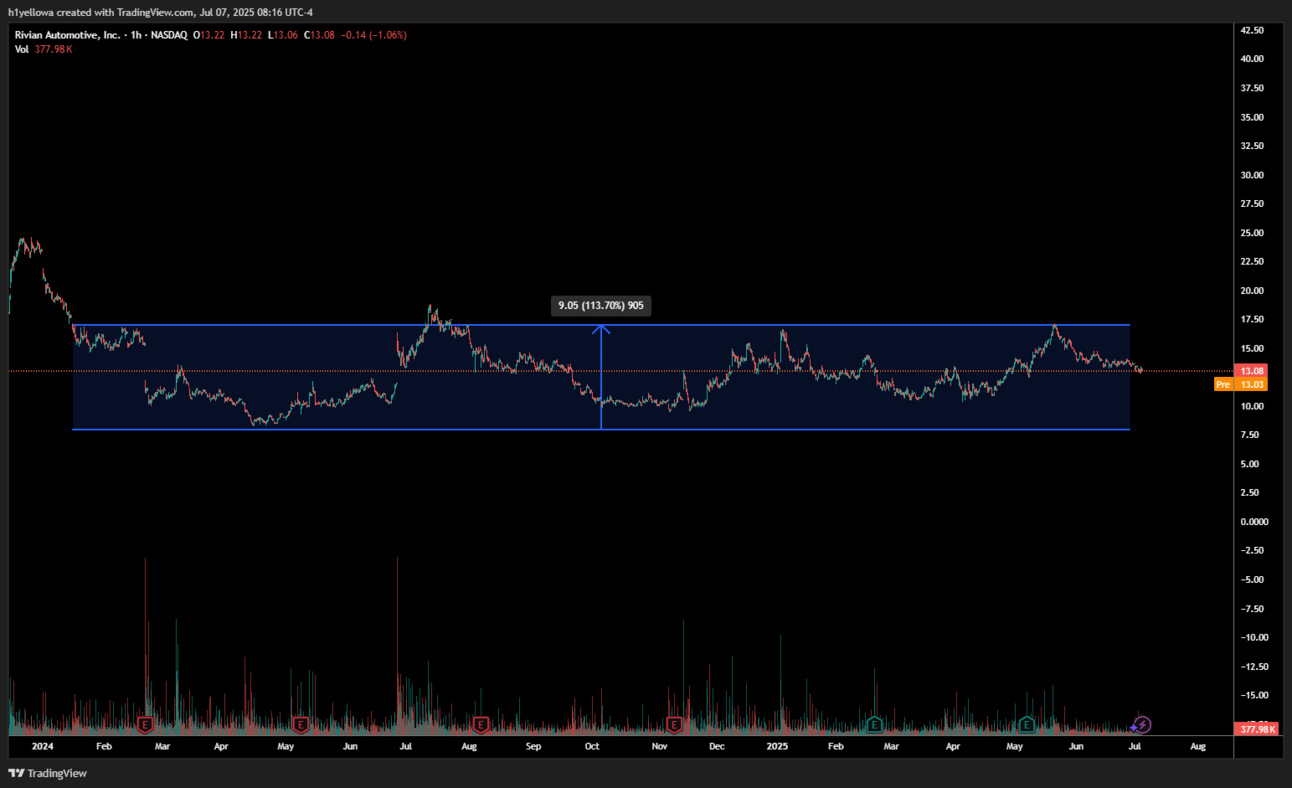
Let’s dive into the Technical analysis. As an analyst who likes charting stocks, I actually like where RIVN has positioned itself all of 2024 through today. Take a look at the chart below. You can see I added a price range indicator to show where RIVN has been consistently bouncing between a low of around $8 and a high of around $17. This chart may prove a few things. One, the market does not want to see RIVN go below this $8 -$10 range as long as the company is continuing to produce sales. The high however is showing the markets pessimism in an electric vehicle company along with the fundamentals that we haven’t gotten into.

As you can see in the chart, today’s price of about $13 is about mid range. This gives someone who is interested in the company a great chance to possibly buy in for a long hold with an understanding to what a stop loss price might look like and what a resistance price might look like. This range over the past year also gives swing traders great trades. You can look to buy in around that $8 - $10 range and hope to get out around the $17 range with an almost 75% profit. (THIS WON’T ALWAYS WORK!)
A Final Note
Please keep in mind politics are playing a huge role in EV stock prices and that is making technical analysis hard remain accurate to the signals we are used to seeing. The range I showed in the chart is that of 133%. Buying at the top could result in 50% losses if the economic struggles continue. Personally, I’m bearish on EV stocks right now. Not because I don’t believe in them but because I think they have stronger headwinds than tailwinds and there are currently better options out there for your money.
“Never financial advise, just a thought”
Reply