- Atlas Portfolio
- Posts
- Following the technicals of PLTR
Following the technicals of PLTR
Palantir Technologies Inc
About PLTRPalantir Technologies, Inc. engages in the business of building and deploying software platforms that serve as the central operating systems for its customers. It operates through the Commercial and Government segments. The Commercial segment focuses on customers working in non-government industries. The Government segment is involved in providing services to customers that are the United States government and non-United States government agencies. The company was founded by Alexander Ceadmon Karp, Peter Andreas Thiel, Stephen Cohen, Joseph Lonsdale, and Nathan Dale Gettings in 2003 and is headquartered in Denver, CO. |  |

Feature Story
Technical Analysis
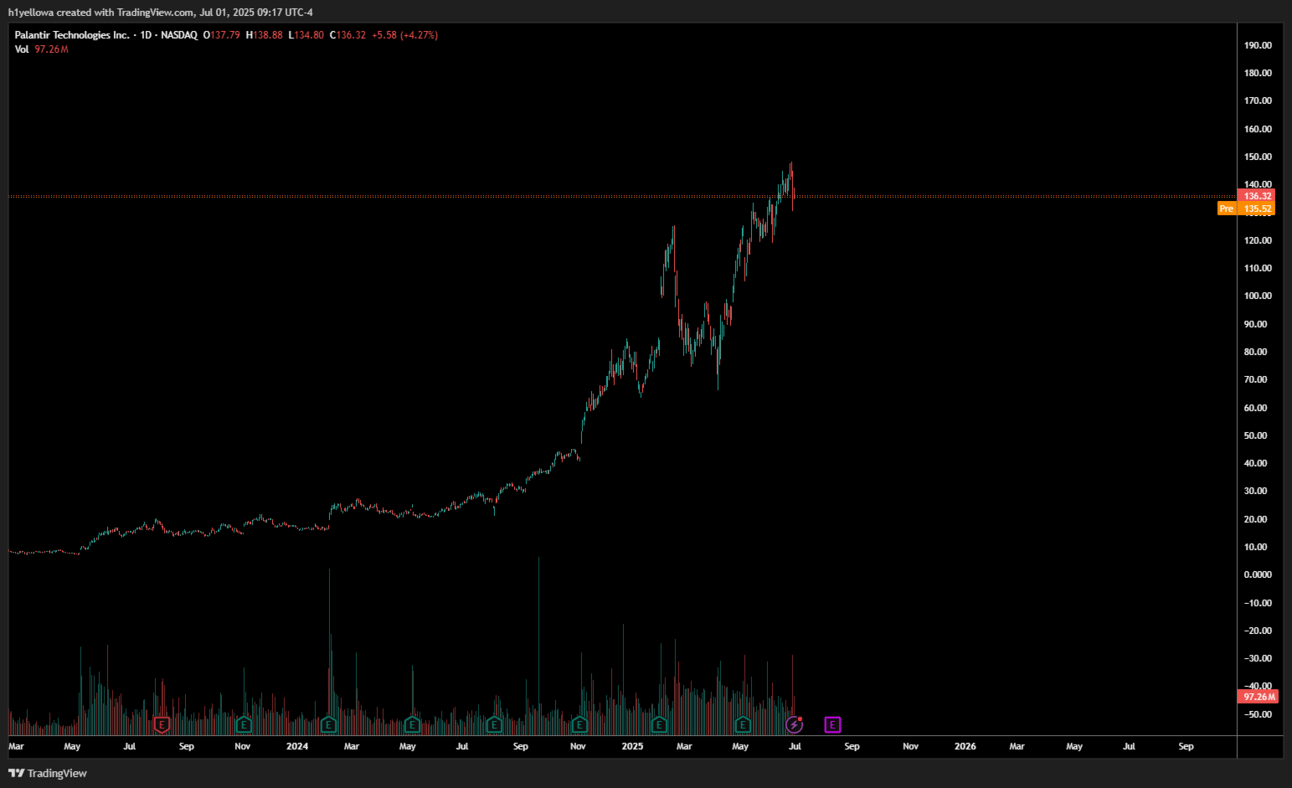
Palantir has been on a rocket ship for over a year now and nobody seems to know when to get on or get off. It seems every week at some point PLTR is testing new highs and rarely retracing to test support levels. Not only that, they are a technology company that benefits from military/government contracts and given the state of the world right now, these types of stocks are benefiting greatly. This makes charting difficult.
One thing to remember there are multiple right and wrong ways to chart. Drawing support lines is based on the perspective of the analyst and so its always healthy to look at multiple charts to get different perspectives before diving into a stock. Here’s what I see.
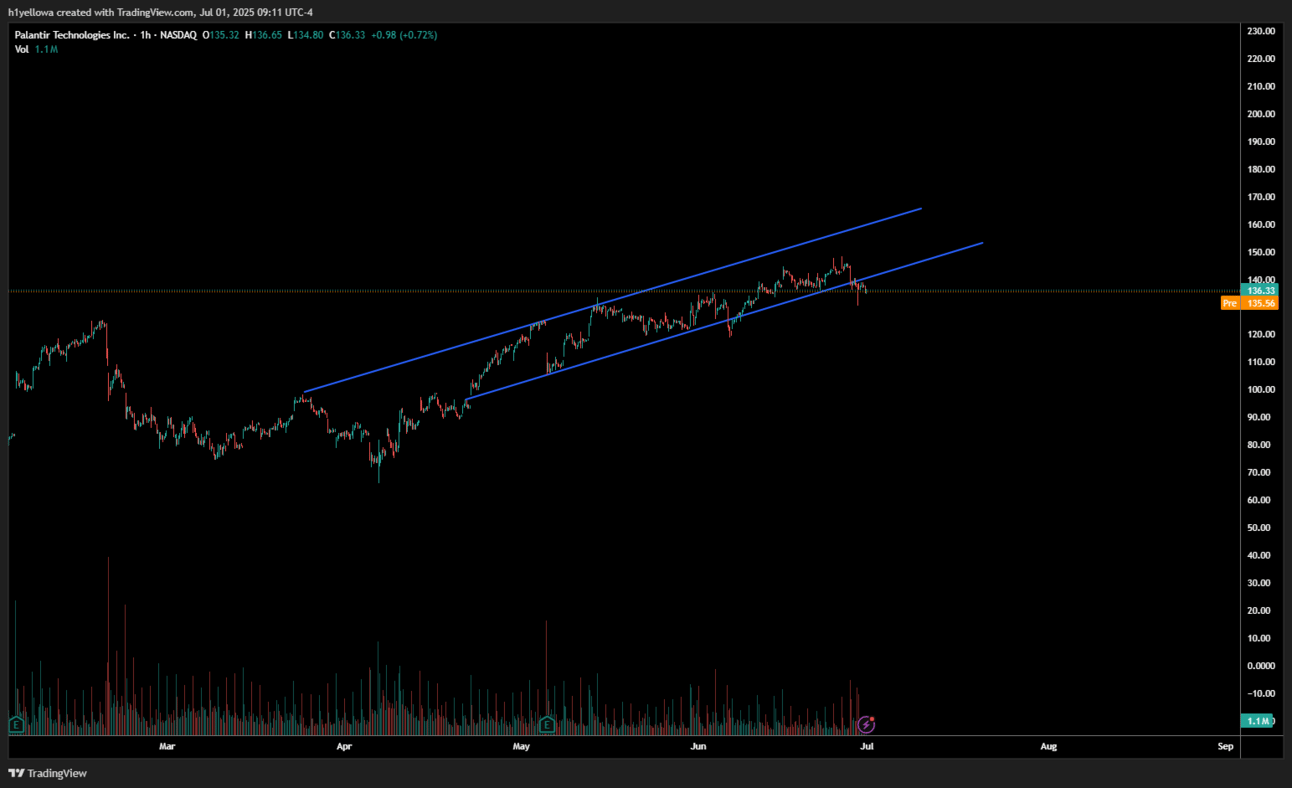
The chart featured below is the one hour chart for the last few months and the chart above is the daily chart for about the last two years. When looking for a buy in point or sell point, its good to acknowledge what’s happening on both. What we see on the daily chart is a pretty parabolic move upwards. These are hard to chart because there are not many resistance or support lines. But just for the sake of it, I’m going to acknowledge that on my personal chart, I have a support line at $136 and $126 on the daily chart and thats about it. PLTR already pushed past the risk of a double top and we are waiting to see what forms at this current level.
On the one hour chart (below) we see more of a persistent move forward with some give and take. This was also hard to draw lines for and it took me a while to settle with this one. Some people may have this drawn further back in time but I’ll explain why I settled here. As you can see with these two lines, PLTR tests the top resistance a few times before coming back down and bouncing around the bottom support line. However, needless to say on 6/30/25 PLTR dipped blow that line and closed below that line. That could be bearish if others see that too. The current premarket price while writing this article on 7/1/25 is $135.61 and I do believe that is a critical support price otherwise we could dip another 10% from there to retest the $120 level.
Overall if you are in PLTR I wouldn’t worry to much about this. Chances are if you entered in the last few months you are in the green and its worth playing this out to see where the next formation forms and whether or not its bearish or bullish.

A Final Note
Where do we go from here?
Likes I said earlier, technicals on a stock like this are difficult to follow when there is so much influence in the world as well as a parabolic move up. This week we will hear jobs reports as well as more news from the FED. This will also effect stocks. Pay attention. Don’t FOMO.
“Never financial advice, just a thought.”
Reply