- Atlas Portfolio
- Posts
- Following the technicals of F
Following the technicals of F
Ford Motor Company
About FordFord Motor Co. engages in the manufacture, distribution, and sale of automobiles. It operates through the following segments: Ford Blue, Ford Model E, Ford Pro, Ford Next, Ford Credit, and Corporate Other. The Ford Blue, Ford Model E, and Ford Pro segment includes the sale of Ford and Lincoln vehicles, service parts, and accessories, together with the associated costs to develop, manufacture, distribute, and service the vehicles, parts, and accessories. The Ford Next segment is involved in the expenses and investments for emerging business initiatives aimed at creating value for Ford in vehicle-adjacent market segments. The Ford Credit segment consists of the Ford Credit business on a consolidated basis, which is primarily vehicle-related financing and leasing activities. The Corporate Other segment refers to corporate governance expenses, past service pension and OPEB income and expense, interest income and gains and losses from cash, cash equivalents, and marketable securities, and foreign exchange derivatives gains, and losses associated with intercompany lending. The company was founded by Henry Ford on June 16, 1903 and is headquartered in Dearborn, MI. |  |
Feature Story
Many people prefer fundamental analysis to technical analysis. Good or bad news is more likely to disrupt the technicals of a stock chart than a bear flag interrupting a price spike upward due to good news. What does that mean? Watching new companies is exciting because you are more likely to see huge price spikes when they do big things such as getting listed on the S&P500, make partnership deals, get bought, etc. Older companies don’t have as many big stories. Their big news comes around earnings each quarter. That means the technical movements of the price on a chart is more likely to be accurate during those in-between earning periods.

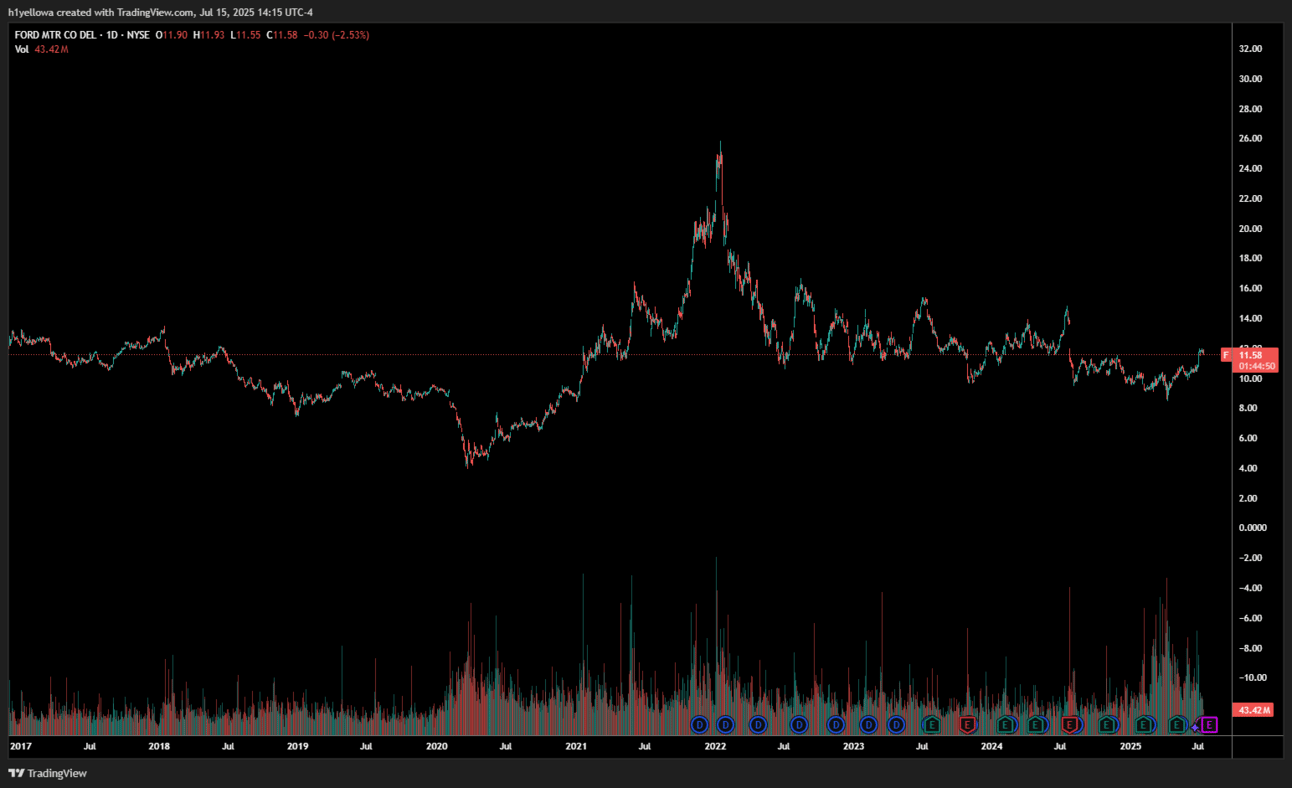
Lets use Ford as an example. Ford has been around for over 100 years. Its a staple to the American automobile. F value does not fluctuate all that much. Todays price at the time of this article (7/15/25) is $11.59 Take a look at this daily chart above. Back in 2017, F was flirting with exactly the same price. Now, this does make F a safe dividend stock, however not a great choice for a growth portfolio (depending who you ask).
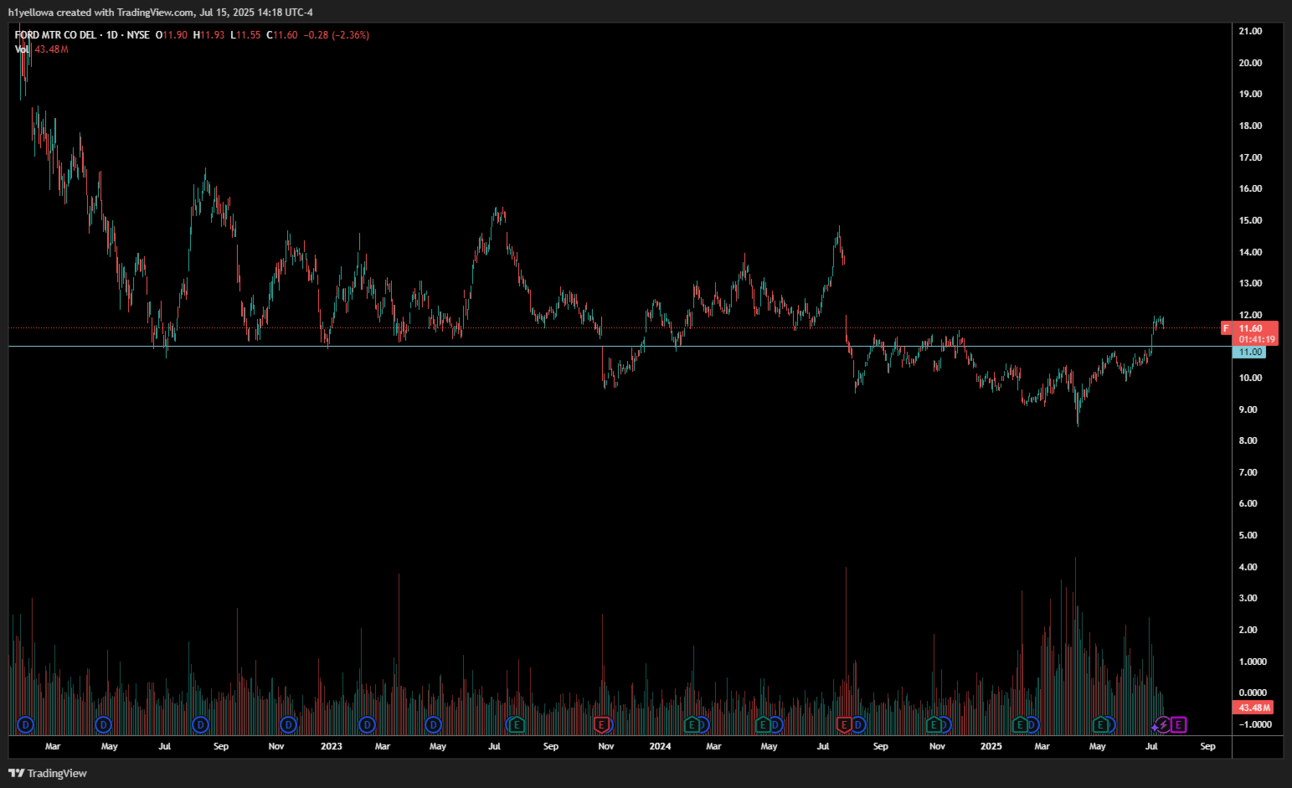
Now look at the daily chart below. This is roughly the last two and a half years. Most of the spikes and dips you are seeing favors the $11 range. Also, most of these spikes and dips correlate to a dividend payment or earnings. Up until recently, F was a safe buy at $11 that can be held until about $14-15. You can use this information for options trades or swing trades.

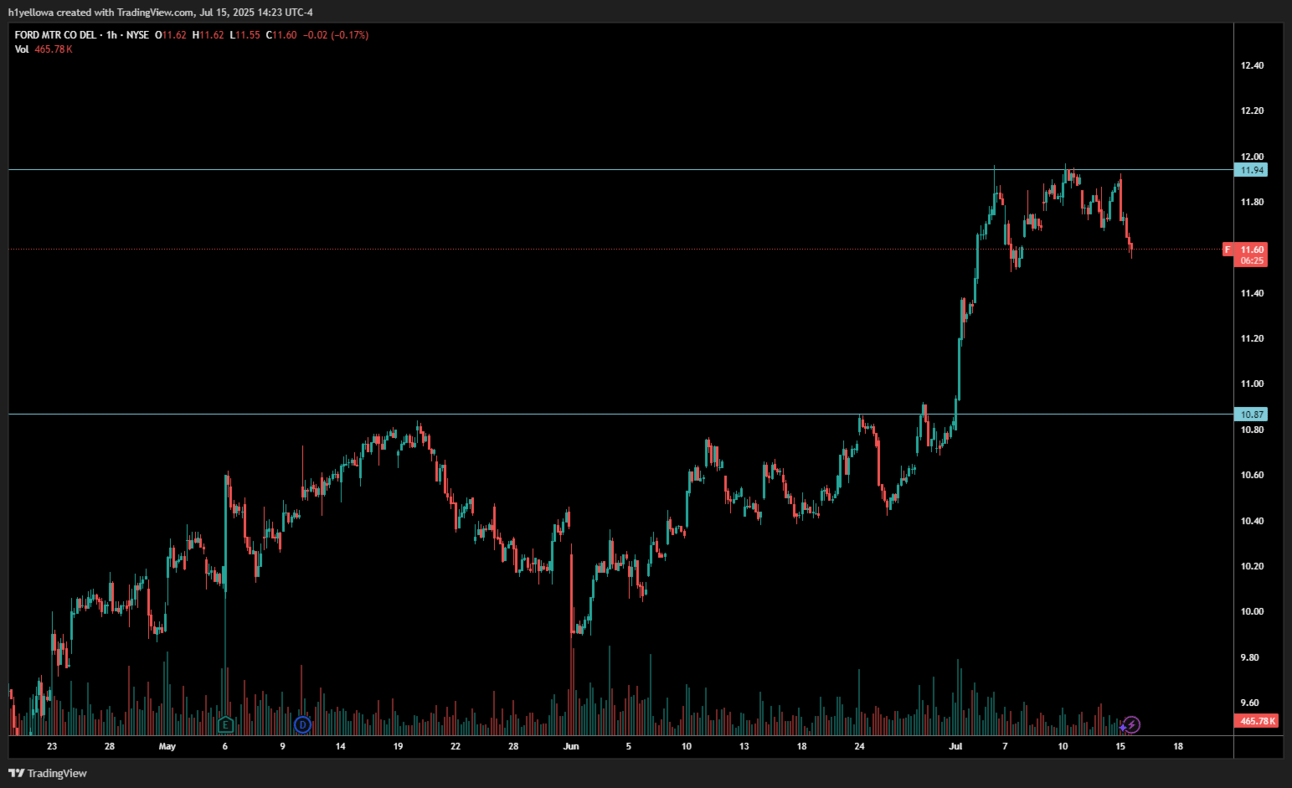
Finally, look at this last hourly chart from about mid April to today. This chart helps me explain what I was saying in my first paragraph about technicals working well in well established companies. We can see a clear resistance line F was up against in the $10.87 range. What made this bullish is that it kept testing this line with higher lows until finally it broke through at the end of June. F pushed up to the $11.94 range where it tested it multiple times and got rejected. Today F is down about 2.4%. Retesting a resistance and creating lower lows is bearish and that is why we are seeing a breakdown in the price today. The technical analysis of this chart would’ve worked if you were watching it for the past few months.

A Final Note
Now what? Remember F likes to bounce off that $11 range. If F continues to break down here, I’d like to see it bounce off that number again. Ideally I’d like to see support at $11.50 first. If F can bounce there then I’d be bullish to see if it can retest the $14-$15 that we are used to F jumping too.
“Never financial advice, just a thought!”
Reply