- Atlas Portfolio
- Posts
- Following the technicals of Bitcoin
Following the technicals of Bitcoin
Cryptocurrency
What is BitcoinBitcoin is a type of digital currency in which a record of transactions is maintained and new units of currency are generated by the computational solution of mathematical problems, and which operates independently of a central bank. |  |
6/30/25

Feature Story
Technical Analysis
What is Bitcoin doing and when is a good entry point? That is the million dollar question isn’t it. There is so much to unravel with Bitcoin that I’m not going to dive into the gritty details of everything that affects the market such as politics, the stock market, FOMO, big company adoption, etc. If you’re reading this article I assume you have a basic understanding of the ups and downs of Bitcoin and are curious on another person’s take for a good entry point as of today.
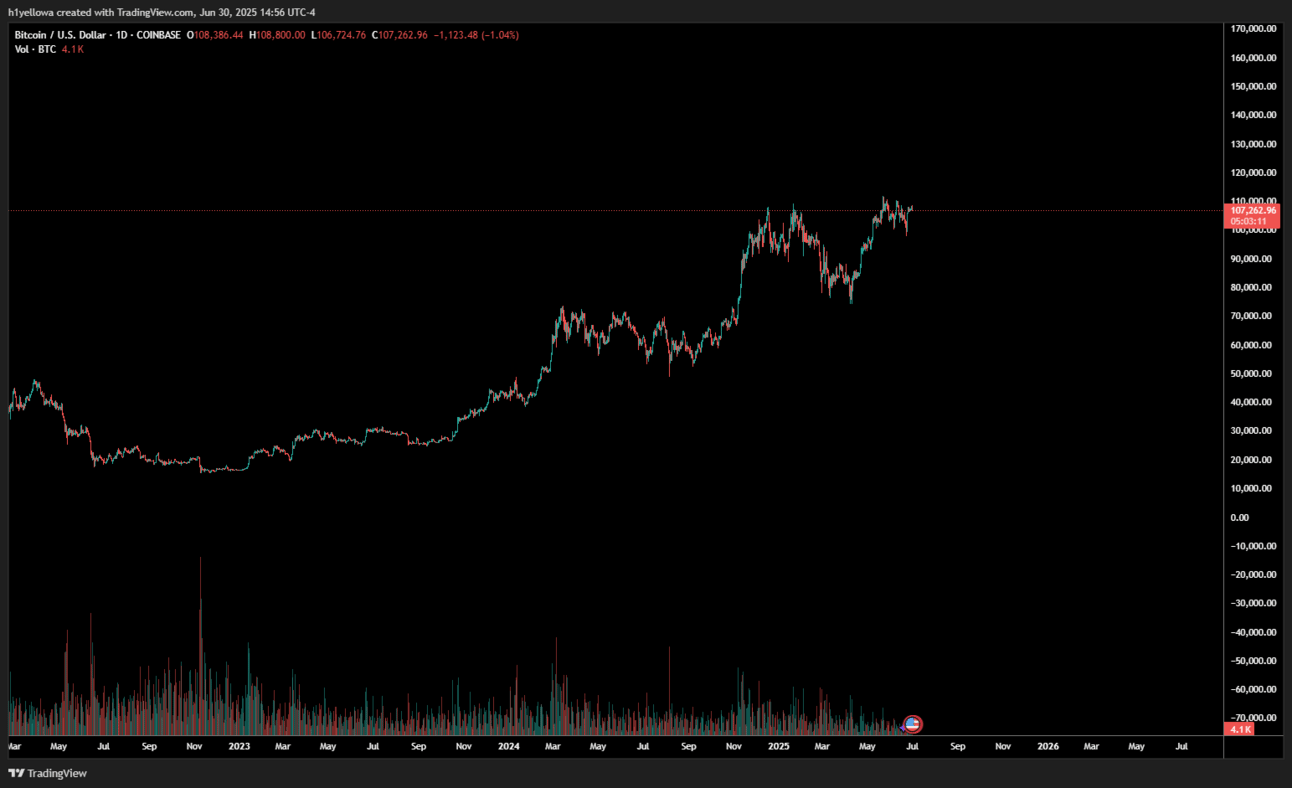
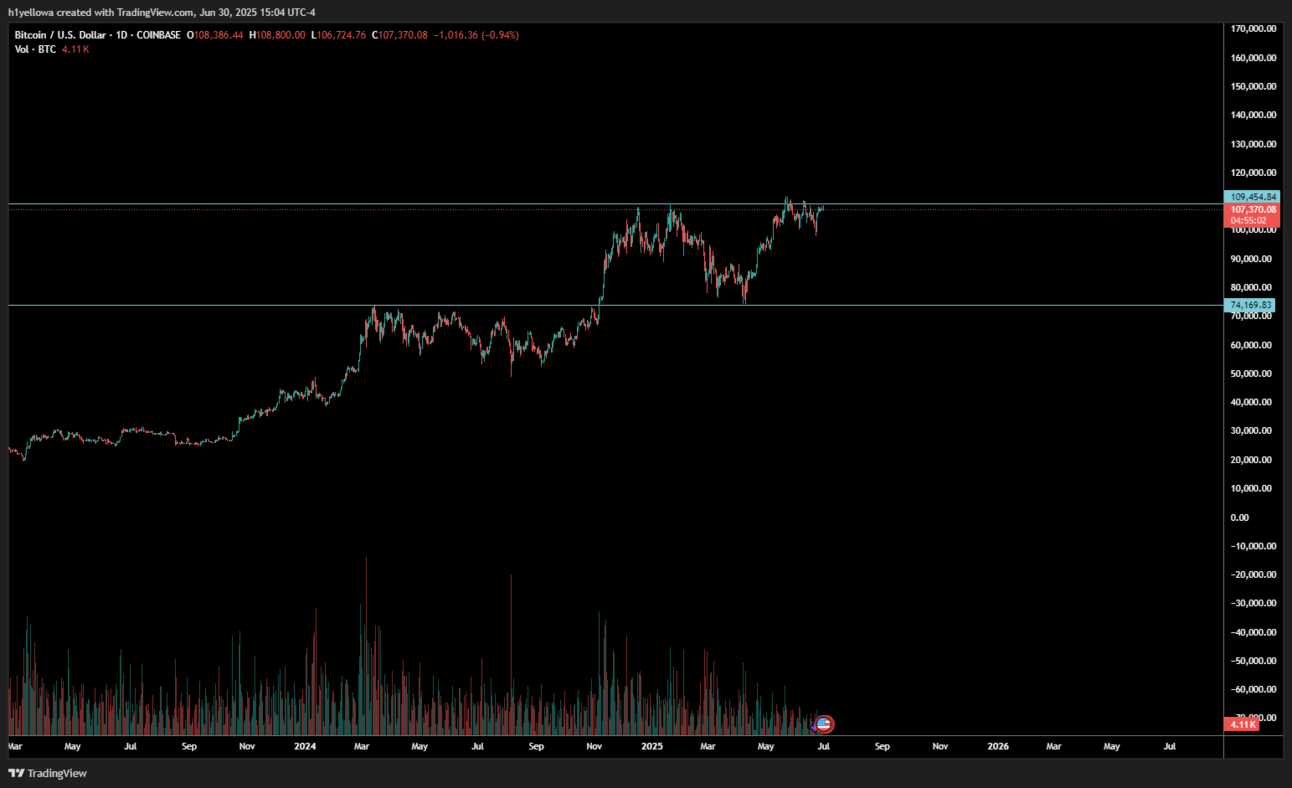
The chart above shows us as of 3pm on 6/30/25. The price while writing this article is $107,262. Honestly I think this is a great range to be in right now if you already own Bitcoin. Bitcoin is only a few thousand from the all time high and consolidating nicely above $100k. Early in April Bitcoin dropped down to about $75k and tested the highs of early 2024. It bounced off of that support line very well and is now retesting the recent highs of $107k-$111k, as you can see with the two lines in the graph below.

Well that is interesting news but what does that mean about where to buy into this? It goes without saying, take the following information with a grain of salt because this is just my interpretation of the charts and people may agree or very much disagree with me. If you are not in yet, I would hold off. One of two things are about to happen (duh) and its either going to pop off hard here and retest the all time high or get rejected hard here and I’m leaning towards the latter.
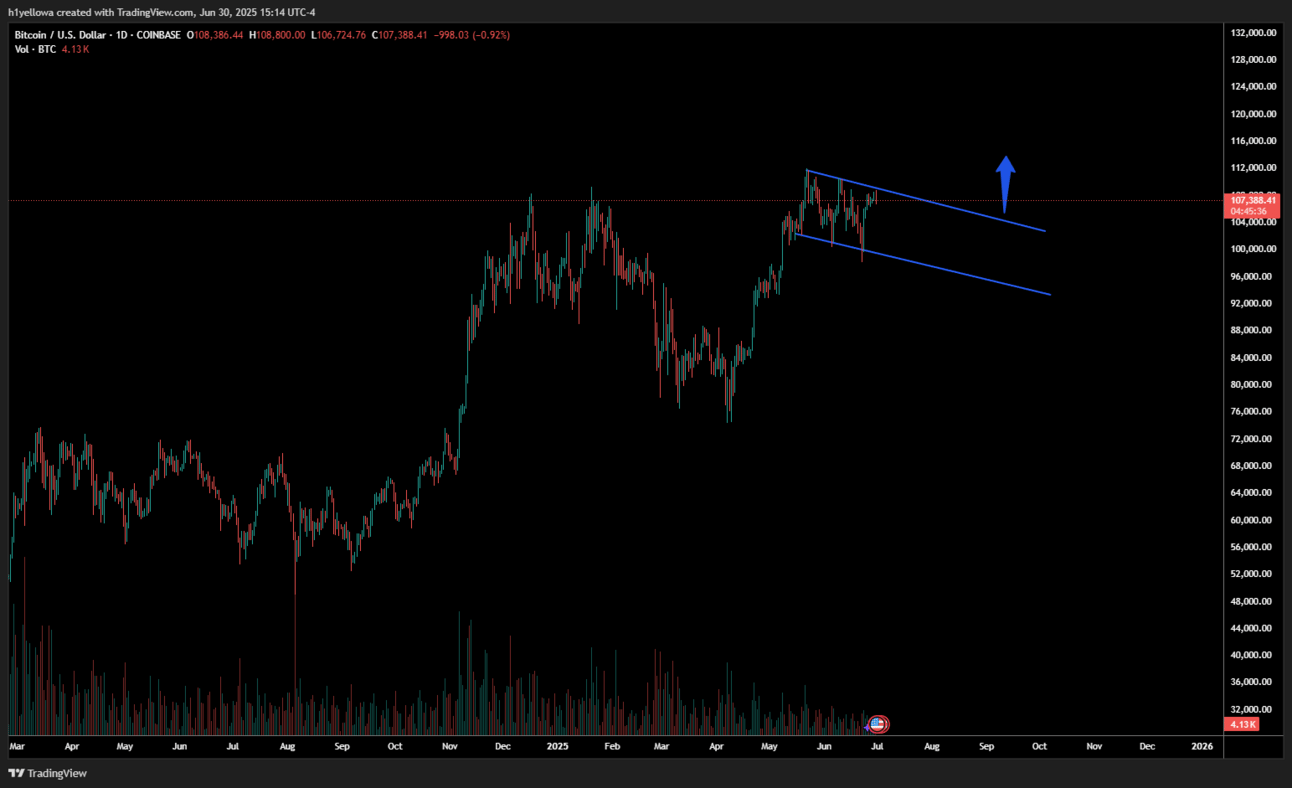
Using the graph below this, I have us zoomed into the last few months on the day chart. These trend lines are normally bullish. We are seeing lower highs with lower lows, but each time it bounces back up, there is a solid chance of pushing past the trend line. When you see this technical marker towards all time highs, that’s generally bullish. My guess, though, is that we are going to see it come back down one more time and possibly test the bottom trend line, or go about halfway down and bounce back up to retest the top trend line. That is one buy in range. That would be the price range of $100k-$103k.

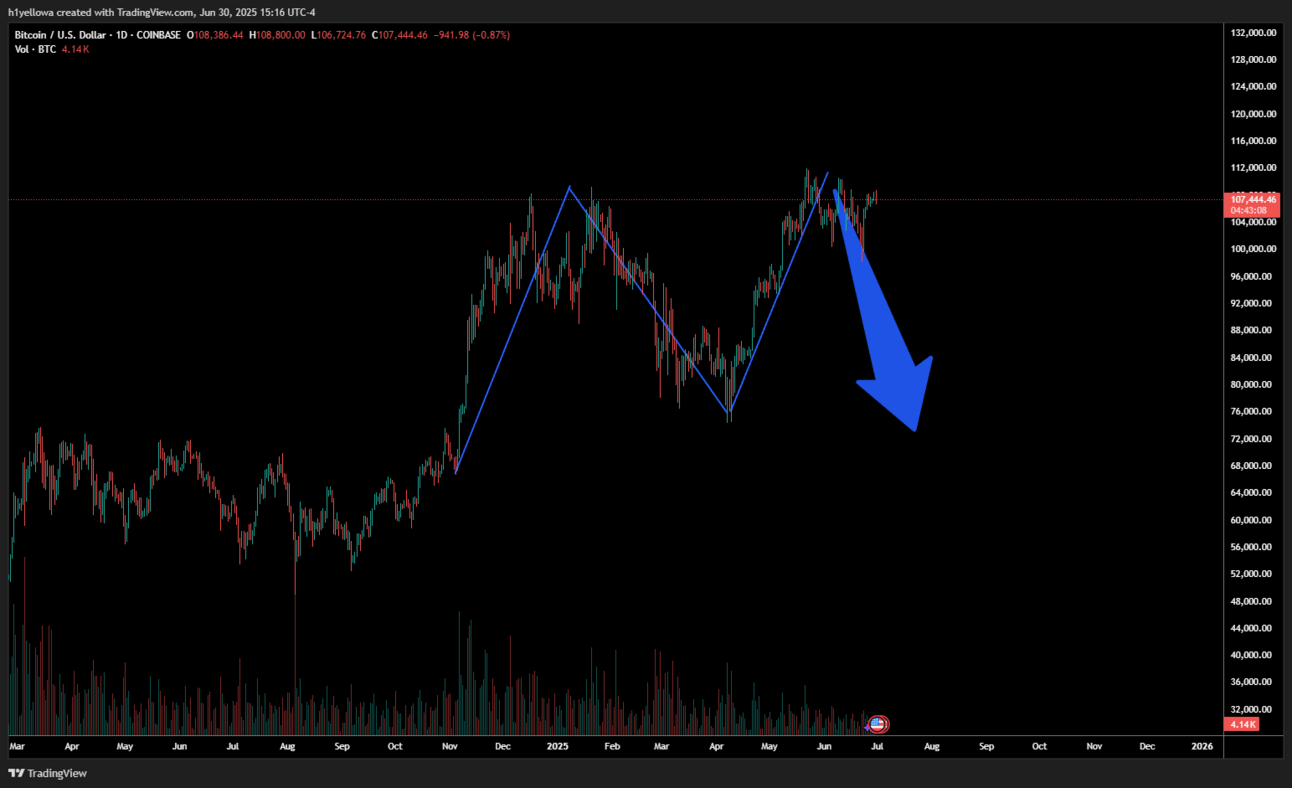
But I still don’t think this is your best spot. People who know how to do technical analysis can already see in the previous chart what I’m about to talk about, and that is the dreaded double top forming. Using the below graph as an example, this is bearish symbol. This is where we retest a previous resistance level after recently bouncing and get rejected again back to the original bottom. If this formation plays out, we could see a retest of the $70k range again and that would be the ideal buy in option in my opinion.

A Final Note
Keep in mind cryptocurrency is EXTREMELY volatile. Any type of world news could affect what happens and drastically change any technical analysis without explanation. Crypto is still just a baby, and like the rest of us, trying to find its place in this crazy world.
Interested in me charting a stock/crypto for you. Subscribe and send an email with the company your interested in!
“Never financial advice, just a though
-Bremcakes
Reply