- Atlas Portfolio
- Posts
- Following the technicals of BBAI
Following the technicals of BBAI
BigBear.ai, Inc
About BBAIBigBear.AI Holdings, Inc. engages in data-driven decision dominance and advanced analytics that provide its customers with a competitive advantage in a world driven by data that is growing in terms of volume, variety, and velocity. The firm operationalizes artificial intelligence and machine learning at scale through its end-to-end data analytics platform. It deploys its observe, orient and dominate products to customers throughout the defense, intelligence, and commercial markets. The company was founded in 2020 and is headquartered in McLean, VA. |  |
Feature Story
Technical Analysis
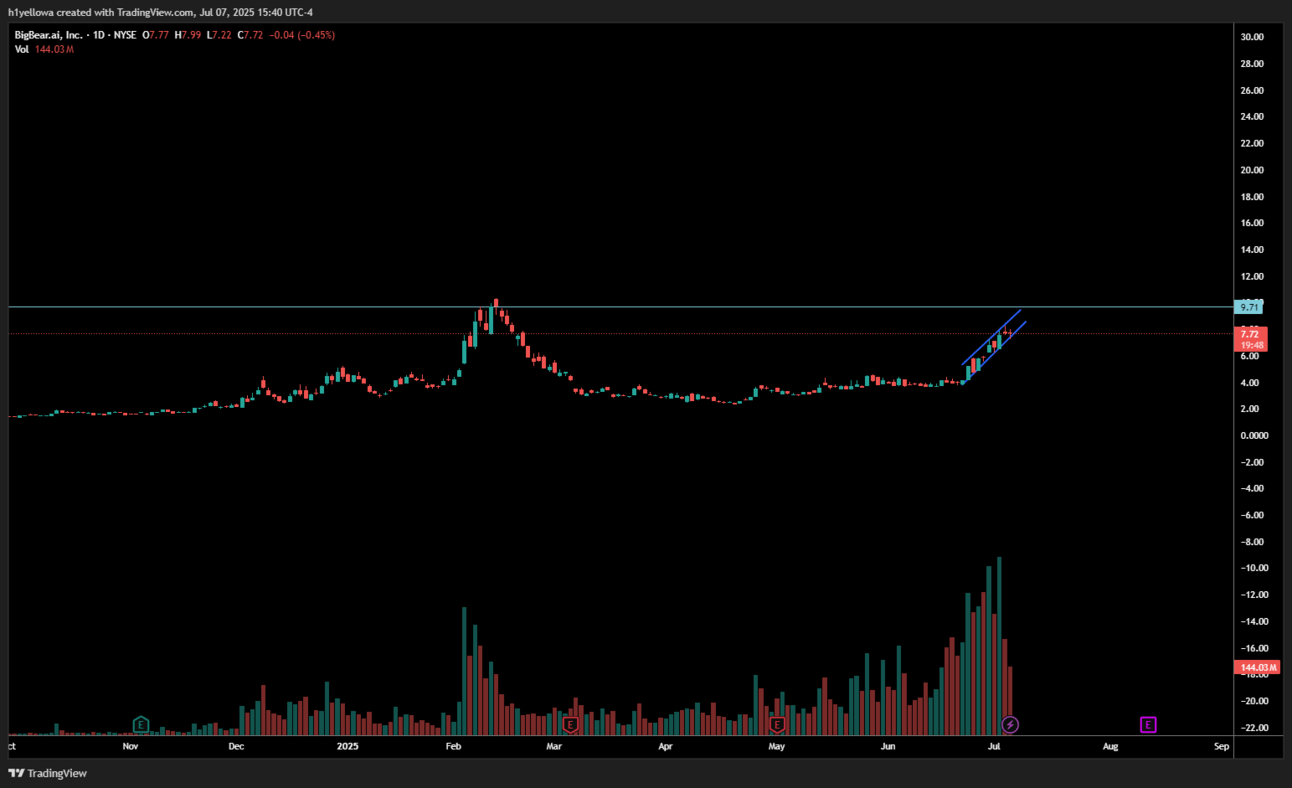
BBAI has been quite lively since last October. BBAI has seen a pump to about $10.30 in February but then saw a consistent decline in the following months until it hit its yearly lows in the $2 - $3 range. However, in mid April BBAI began to see another slow upward movement until just the end of June when BBAi saw another large gap upwards jumping a span of roughly 120% in the last two and a half weeks.
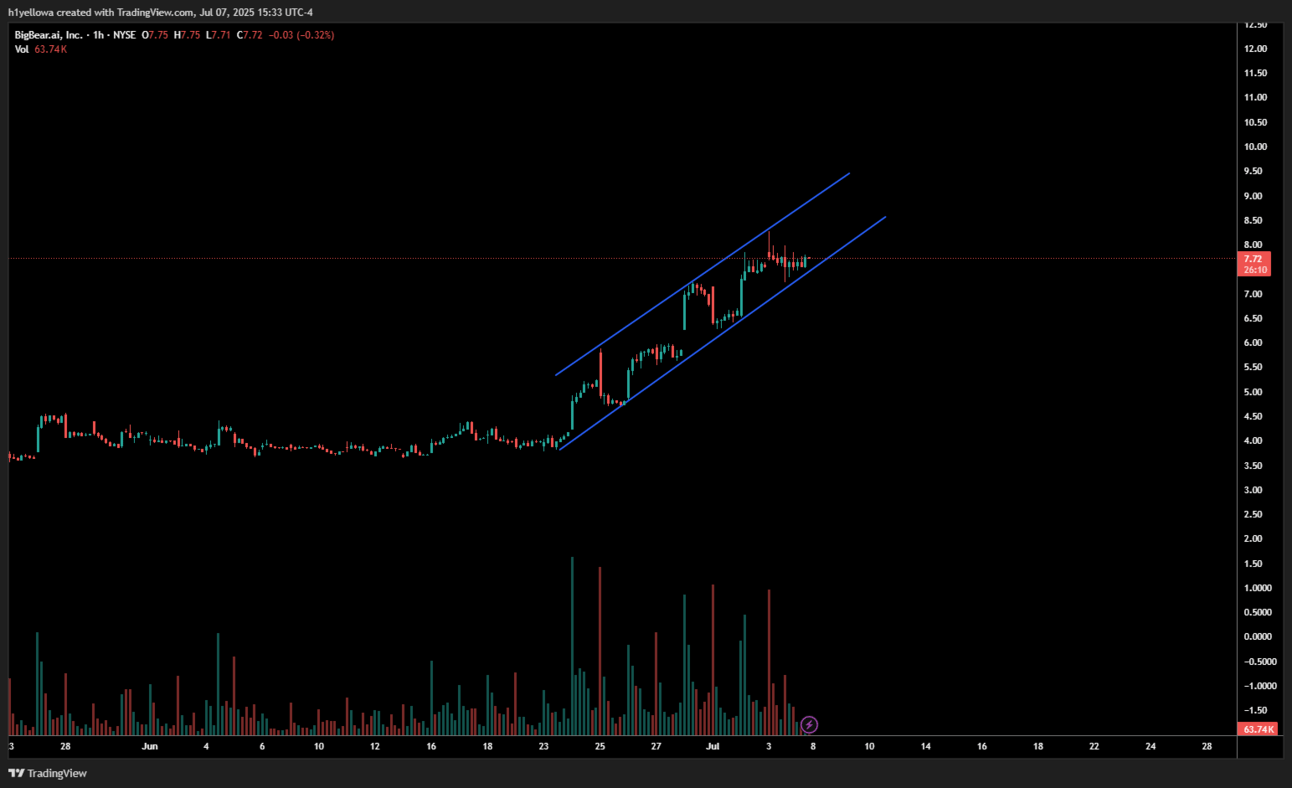
It wasn’t to hard to draw in a channel to show the last half month move upwards and it looks very clean. Check out the chart below (1hr chart). What we are seeing is higher highs and higher lows. What makes this bullish is how nicely the price has been respecting the lower support level of this channel, however on the opposite side, we are now retesting the bottom level again after testing it multiple times before retesting the resistance line. This could be bearish.

I’m going to be honest with you, BBAI is in a very delicate place right now. I wouldn’t disagree with you if you saw a bullish movement after today (7/7/25) and I wouldn’t disagree with you if you saw a bearish movement after today. Not a lot of profit taking has been done in this 120% move up. That’s good, the stock is consolidating and creating new support levels as it goes up.

If you take a look at the daily chart above, you can see I added in a resistance line, just to try and give a target price for the near future. I think that price is around $9.71. This was a strong resistance area the last big move up and buyers are going to notice that. I’m not saying we are going to definitely test this, but I believe this would be the next big test in the near future if there was one. If BBAI were to fall here, I’d like to see support at the $7.15 range and then again at the $6.50 range.
A Final Note
Today (7/7/25) was a weird day for the stock market. We saw many stocks suffer and some benefit to the “big beautiful bill” that got passed over the weekend. BBAI managed to stay neutral today; at the time of writing this article only down 0.5% at a price of $7.71. Trumpenomics seem to favor tech, but not when tariffs come into effect. As always technicals don’t lie, but sometimes they can be thrown to the wayside when outside influences come into play
“Never financial advice, just a thought.”
Reply